
What Needs To Happen For Next Leg Up To $130,000

The Bitcoin price is on the edge of a major breakout, with momentum building as it approaches major resistance. According to a recent technical analysis, the next leg up could propel BTC toward $130,000; however, a few critical bullish confirmations are needed first.
Bitcoin Price Set For New $131,000 ATH Target
Crypto analyst Hov presented a new Elliott Wave technical analysis of the Bitcoin price in a recent post on X (formerly Twitter). According to Hov, the flagship cryptocurrency could surpass its previous all-time high of above $109,000 and reach $131,060 during this market cycle.
The analyst has outlined a detailed roadmap for Bitcoin to hit this new target, emphasizing a bullish confirmation pattern supported by key technical indicators.
Hov remains optimistic about Bitcoin despite its recent downtrend and price crash, citing the cryptocurrency’s approach toward a key bullish confirmation as the driving force of his projection. The analyst disclosed that Bitcoin‘s slow grind upward has brought it just below a key resistance level in the $89,000 – $94,000 range.
Examining the analyst’s price chart, the structure from the recent low is developing as a potential diagonal pattern, typically regarded as a valid bullish confirmation formation in Elliott Wave Theory. However, Hovs warns that the resistance is not the ideal level to initiate new positions as a trader.
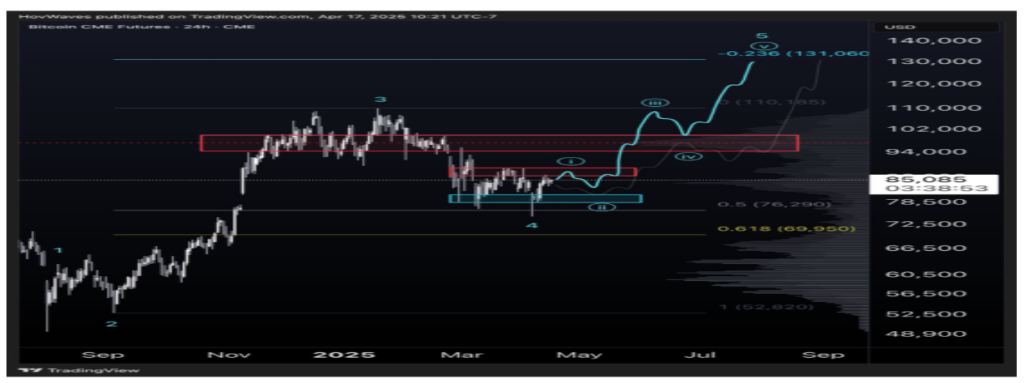
Instead, traders should watch closely for a small leg higher to complete Wave 5 in the immediate time frame. This would mark the end of the short-term impulse and trigger a healthy Wave 3 pullback — a key part of the bullish confirmation.
With Bitcoin currently in Wave 5, the support of around $80,000 is now the most critical level to watch. A pullback that finds buyers at this level would confirm the strength and potentially set the stage for a powerful Inverse Head and Shoulder pattern at the base of the chart.
Should Bitcoin hold $80,000 during the pullback and reclaim the $89,000 resistance, it would validate a larger Wave 3 move. This breakout would likely carry the price toward a 1:1 Fibonacci extension target at $94,000 as the first stop.
However, the real challenge lies ahead, with psychological and macro resistance near $100,000. A Higher Timeframe (HTF) close above this level would be a major bullish signal, opening a path toward new highs, with Fibonacci Extensions pointing to a possible top at $131,060.
As Hov’s chart outlines, if the wave structure continues to play out, Bitcoin could be gearing up for its most explosive breakout. However, as stated, confirmation at key levels will be the deciding factor for whether this bullish setup becomes a reality.
Bitcoin Price Action Update
The Bitcoin price is currently trading at $84,968, marking a modest 1.6% gain over the past week. Despite predictions of a price breakdown due to the heightened volatility resulting from recent political developments in the United States (US), the leading cryptocurrency remains resilient, aiming to break past critical resistance levels and reach new highs.
According to CoinCodex’s data, Bitcoin has shifted into neutral territory after previously being stuck in a bearish sentiment zone. While its Fear and Greed Index still reflects uncertainty, the cryptocurrency maintains a broadly bullish outlook over the long term.
Featured image from Shutterstock, chart from TradingView
Editorial Process for bitcoinist is centered on delivering thoroughly researched, accurate, and unbiased content. We uphold strict sourcing standards, and each page undergoes diligent review by our team of top technology experts and seasoned editors. This process ensures the integrity, relevance, and value of our content for our readers.