Strategy Starts May With 1,895 Bitcoin Buy—Is More Coming?

Michael Saylor’s Strategy has announced a new Bitcoin purchase to start off May. Here’s how the rest of the month could go, based on past pattern.
Strategy Has Just Added 1,895 BTC To Its Bitcoin Stack
In a new post on X, Strategy chairman and co-founder Michael Saylor has announced the latest Bitcoin purchase by the company. According to the filing with the SEC, Strategy acquired a total of 1,895 BTC at an average price of $95,167 between April 28th and May 4th.
With this $180.3 million purchase, the combined BTC holdings of the firm have risen to 555,450 BTC. In total, the company spent $38.08 billion to acquire this stack.
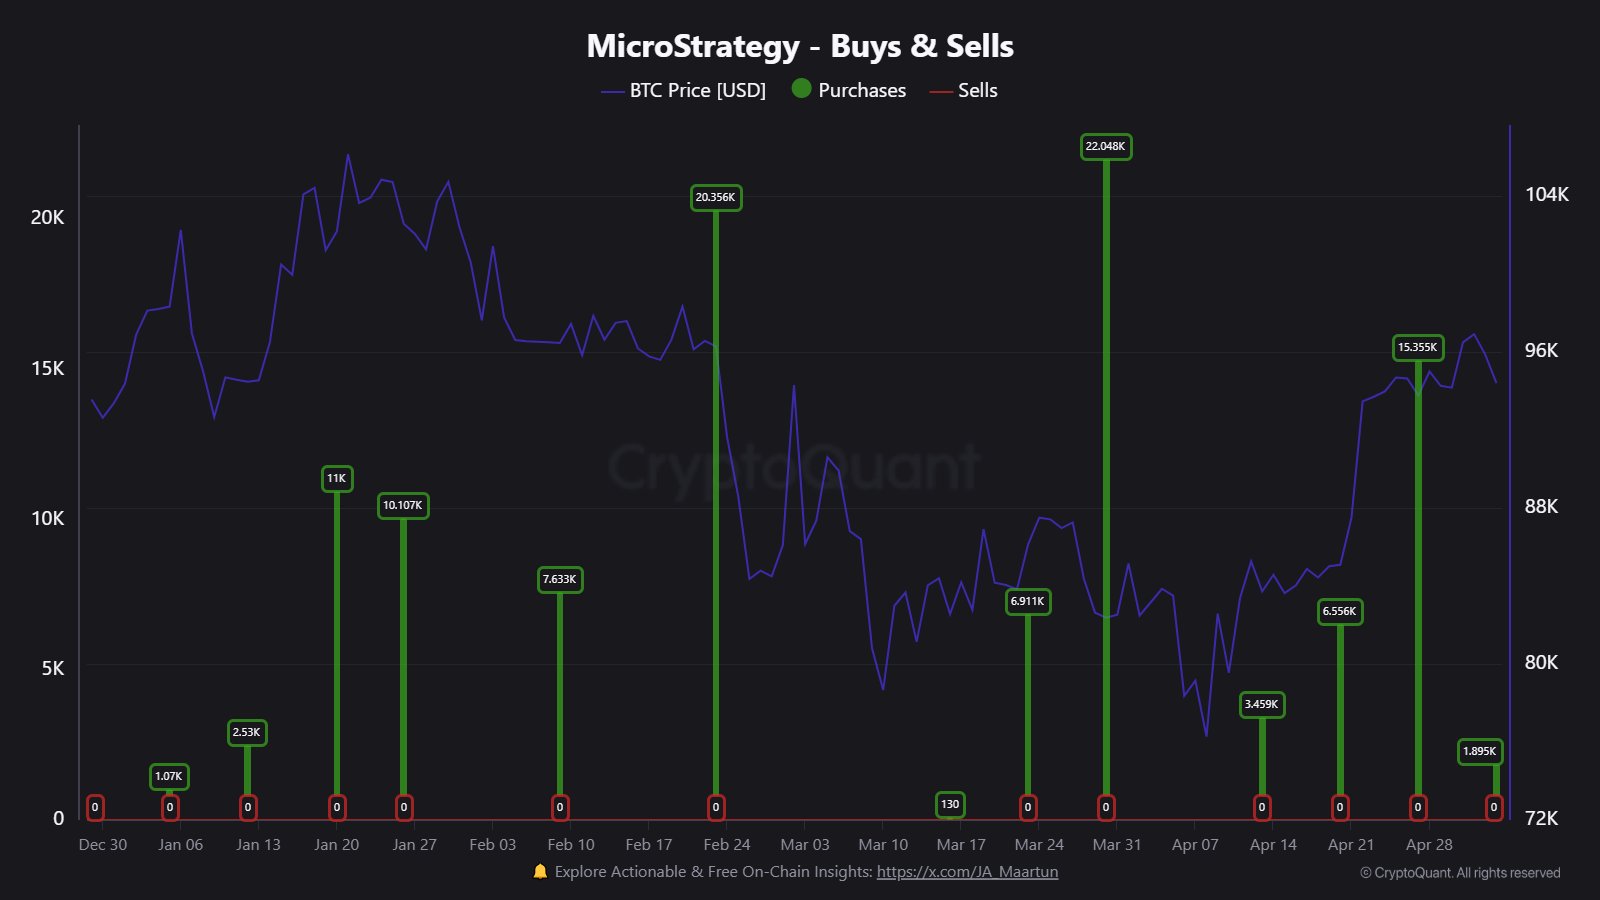
During the last few months, Strategy has been active with their Bitcoin buying and CryptoQuant community analyst Maartunn has noticed an interesting pattern related to these purchases.
Below is the chart that the analyst has shared.
The timeline of the purchases made by the firm during the last few months | Source: @JA_Maartun on X
“The first MicroStrategy purchase of the month is always the smallest. It build up as the month progresses,” notes the analyst. The latest 1,895 BTC acquisition happens to be the first one for the month of May. As such, it’s possible that later buys in this month, if any, would involve a larger amount than this, if the pattern is anything to go by.
The Bitcoin reserve of the company currently has its cost basis at around $68,550, so at the latest exchange rate of the cryptocurrency, it would be sitting on a profit of about 38%. So far, it would appear the bet of Saylor’s firm is working out.
In some other news, CryptoQuant author Axel Adler Jr has shared how BTC is currently looking from the lens of the Composite Volatility Index devised by the analyst.
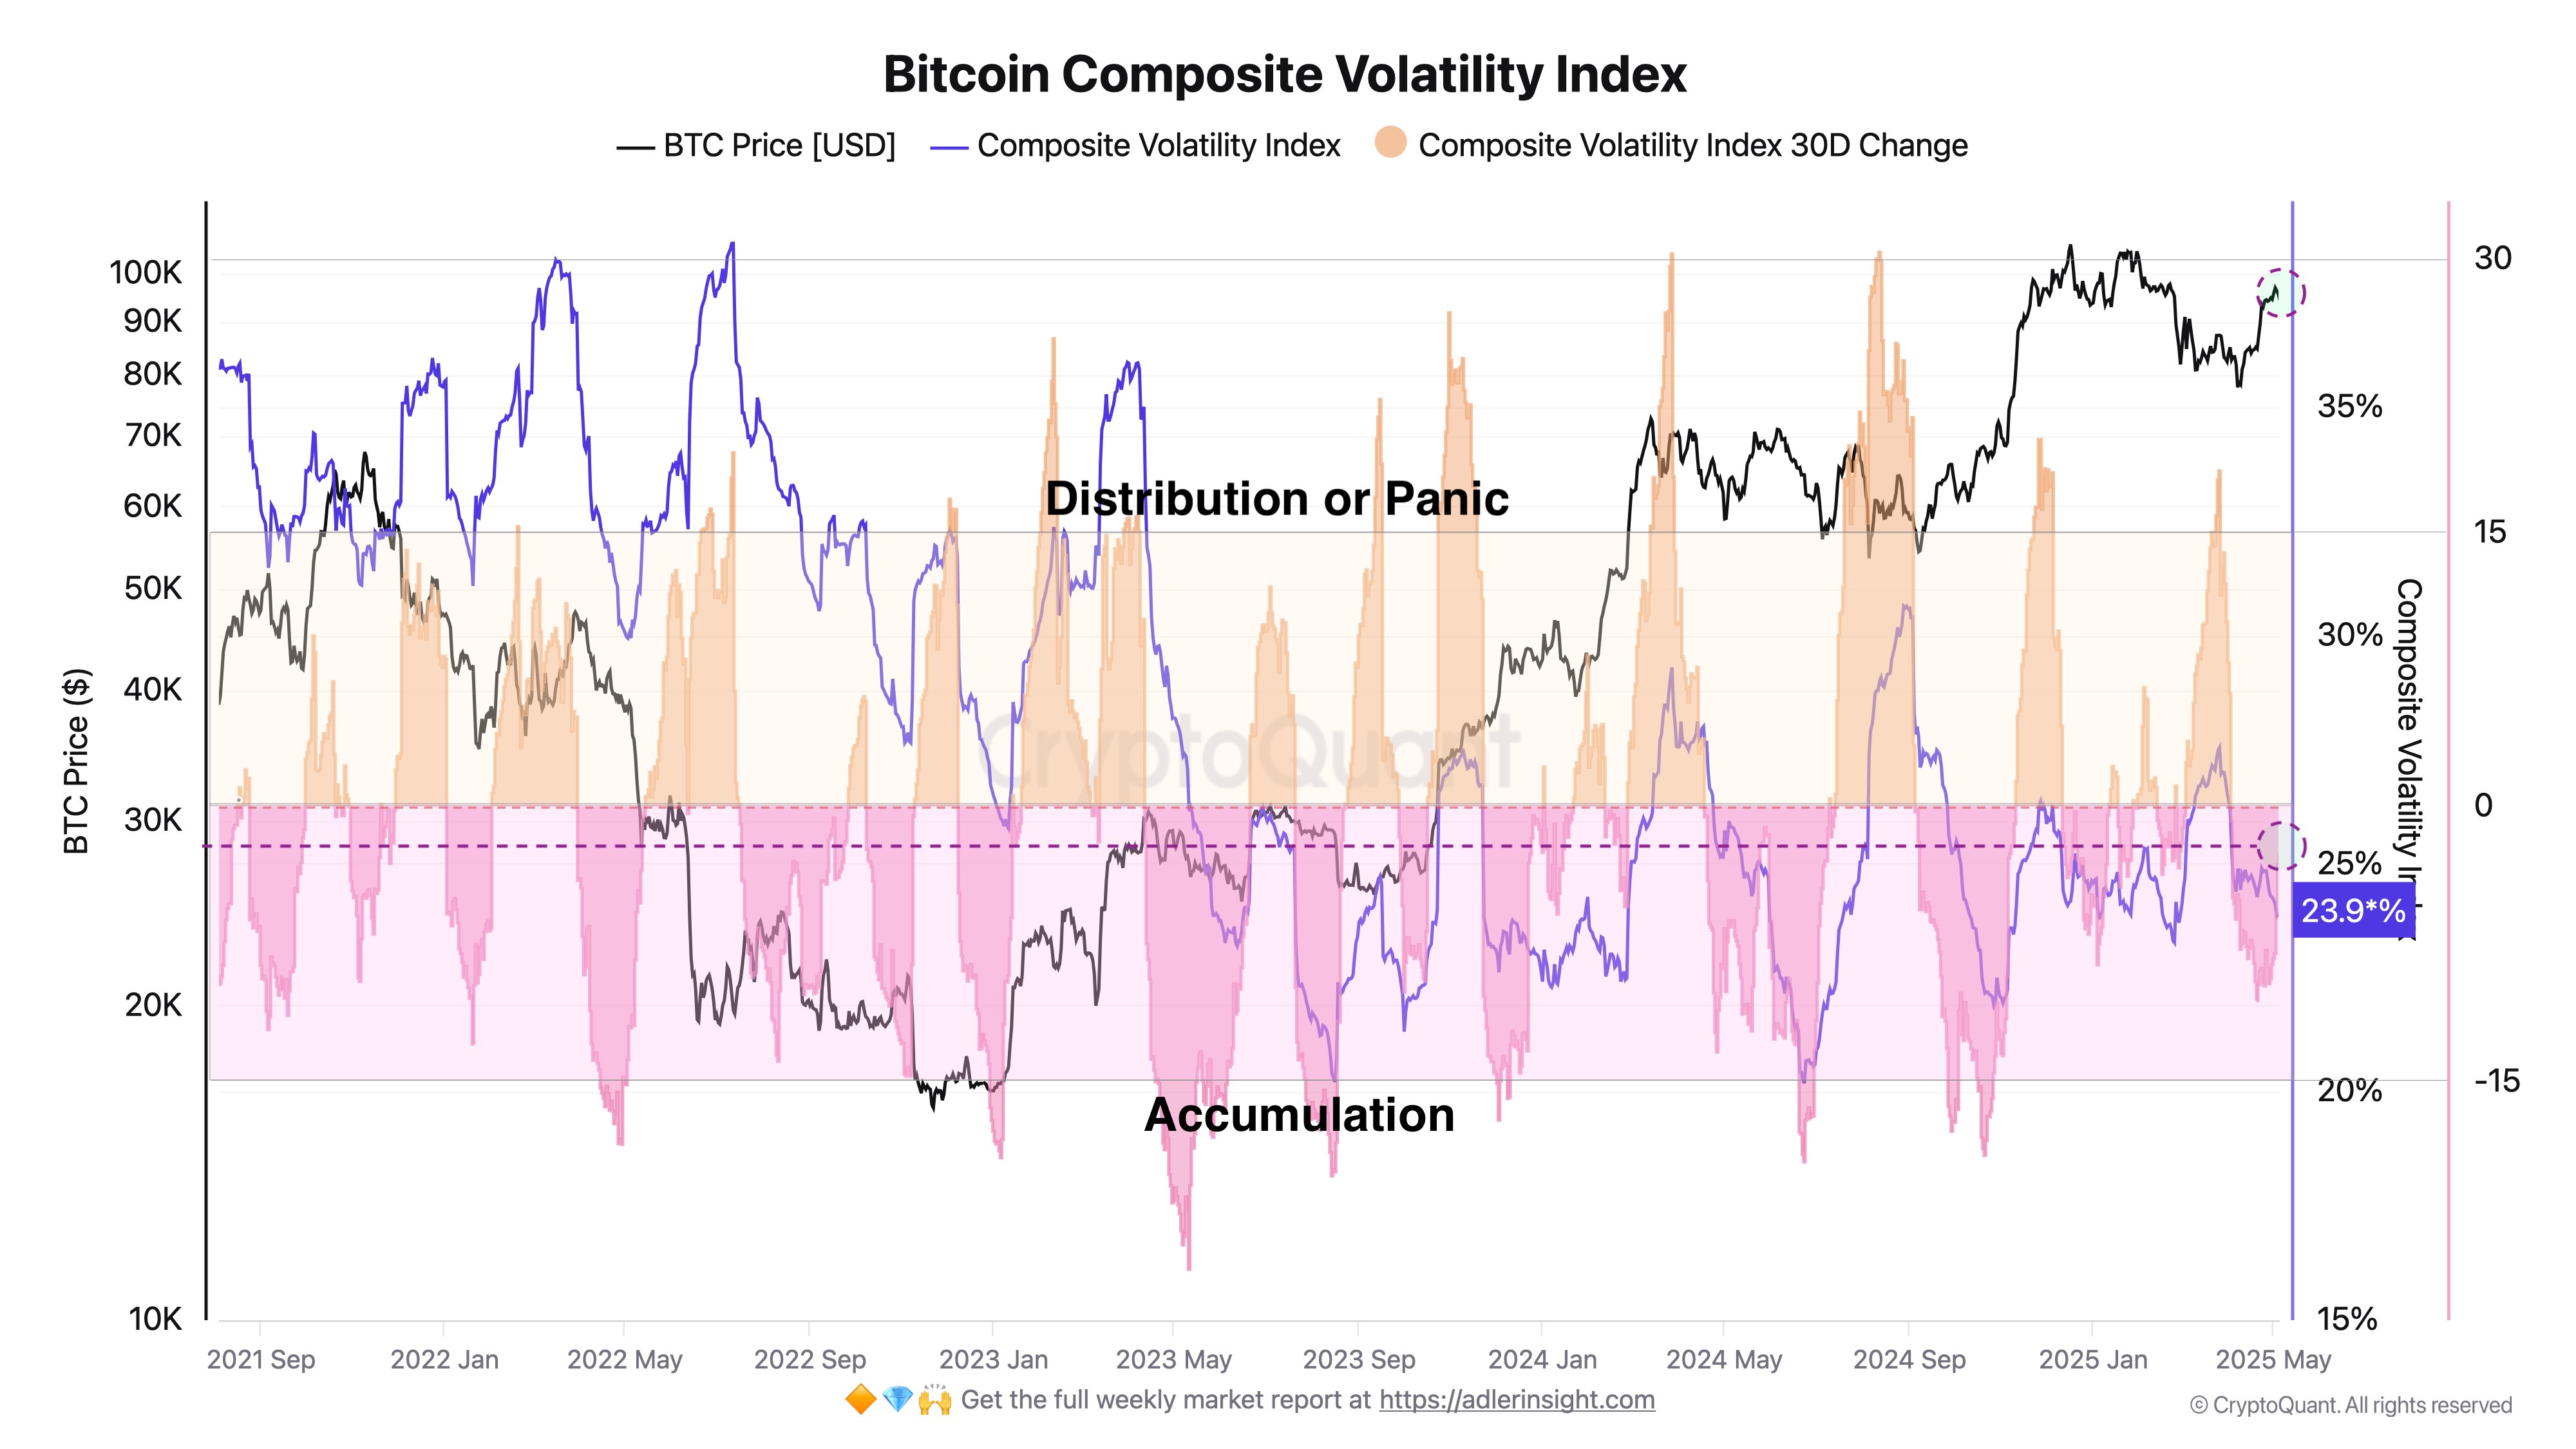
“Analysis of Bitcoin address activity, which underpins the Composite Volatility Index and its 30-day change, allows us to identify market macro phases,” notes Adler Jr.
Here is the chart for the indicator shared by the analyst, which shows the trend in its daily value and 30-day change over the last few years:
Looks like the 30-day change in the metric has been negative in recent days | Source: @AxelAdlerJr on X
According to Adler Jr, the 30-day change in the Bitcoin Compositive Volatility Index being below the 0% mark suggests an accumulation phase from the investors. Similarly, it being above 15% indicates a distribution or panic-selling phase.
From the above graph, it’s apparent that the 30-day change in the indicator has assumed a negative value recently. At present, it’s sitting at -3.5%. Therefore, from the perspective of this indicator at least, the investors are accumulating.
BTC Price
Bitcoin saw a pullback to levels below $94,000 earlier in the day, but it appears the coin has found a rebound as its price is now back at $94,800.
The trend in the BTC price over the last five days | Source: BTCUSDT on TradingView
Featured image from Dall-E, CryptoQuant.com, chart from TradingView.com

Editorial Process for bitcoinist is centered on delivering thoroughly researched, accurate, and unbiased content. We uphold strict sourcing standards, and each page undergoes diligent review by our team of top technology experts and seasoned editors. This process ensures the integrity, relevance, and value of our content for our readers.


