

Bitcoin Could See Weekend Rally To $100K, Ready For New ATH?
Reason to trust
![]()
Strict editorial policy that focuses on accuracy, relevance, and impartiality
Created by industry experts and meticulously reviewed
The highest standards in reporting and publishing
Strict editorial policy that focuses on accuracy, relevance, and impartiality
Morbi pretium leo et nisl aliquam mollis. Quisque arcu lorem, ultricies quis pellentesque nec, ullamcorper eu odio.
As Bitcoin (BTC) attempts to break out from its weekly range, its price eyes the crucial $99,000-$100,000 resistance barrier, fueling bullish sentiment among investors. Multiple analysts forecast that the flagship’s crypto next all-time high (ATH) rally is around the corner, with some suggesting that the initial jump could come in the coming days.
Related Reading
Bitcoin To $100,000 This Weekend?
Over the past two weeks, Bitcoin has recovered from its sub-$80,000 correction, breaking above the $90,000 mark and reclaiming the $93,5000 resistance to re-enter its post-US elections price range.
Amid its recovery, the cryptocurrency consolidated between the $93,000-$96,000 range, moving sideways for the last weeks. The start-of-month pump has seen BTC break out of this range after being compressed during this period, resembling its performance from two weeks ago.
Analyst Daan Crypto Trades explained that BTC surged to the $83,000-$86,000 region during the mid-April recovery, consolidating for over a week before a small 2% breakout toward the $87,500 resistance. This was followed by a two-day “tight chop” and a breakout to a new higher range.

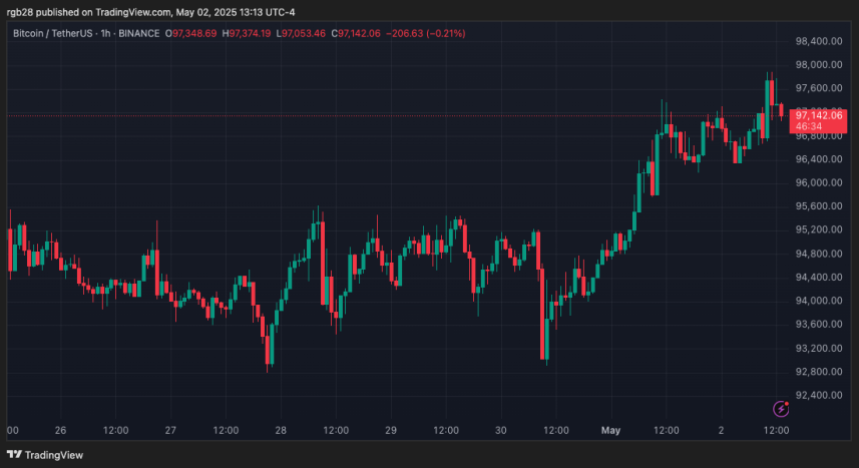
He suggested that Bitcoin displays “a similar setup as the week before” as it has ranged and compressed within the $93,000-$96,000 zone and jumped around 2% to the $97,700 mark.
Additionally, the largest crypto by market capitalization’s “tight chop” phase could have started as its price has hovered between $97,050 and $97,700 for the past few hours.
If BTC replicates its recent performance, the flagship crypto could rally around 8% toward a new range at the end of the weekend and retest $99,000-$100,000 in the coming days.
BTC Resembles Q4 2024 Price Action
Meanwhile, analyst Rekt Capital suggested that Bitcoin could repeat its Q4 2024 performance. He highlighted that BTC has recovered from its downside deviation to reclaim its recent re-accumulation range, but it’s facing a lower high resistance within this zone.
Notably, the cryptocurrency experienced the same situation in the post-halving re-accumulation range, initially rejected from the lower high to fall to the range’s lows. Weeks later, Bitcoin broke above the lower high resistance, restesting it as support before breaking out and soaring to a new ATH.
The analyst noted that the idea was first explored before the US election pump, suggesting that BTC could mimic its Q1 2024 rally, fueled by the US spot Bitcoin Exchange-Traded Funds (ETFs).

“It would be poetry if Bitcoin repeated history and followed through on the same path in this current Range as well,” he stated.
However, Rekt Capital detailed that for history to repeat, Bitcoin must get rejected at $99,000, hold the $93,500 mark as support, and break the $97,000-$99,000 range before being rejected at the $104,500 resistance.
Related Reading
Then the flagship crypto would need to hold the $97,000-$99,000 range as support for a similar breakout to new ATHs.
The analyst concluded that if Bitcoin continues holding the $93,500 mark, the price will be positioned to move across its re-accumulation range. Nonetheless, BTC must break its “black Lower High resistance within this Range, which is positioned at ~$99k this week.”
As of this writing, Bitcoin trades at $97,461, a 3% increase in the weekly timeframe.
Featured Image from Unsplash.com, Chart from TradingView.com