
Cardano Market Structure Says Crash Is Coming, But $0.9 Is Still In The Cards
Reason to trust
![]()
Strict editorial policy that focuses on accuracy, relevance, and impartiality
Created by industry experts and meticulously reviewed
The highest standards in reporting and publishing
Strict editorial policy that focuses on accuracy, relevance, and impartiality
Morbi pretium leo et nisl aliquam mollis. Quisque arcu lorem, ultricies quis pellentesque nec, ullamcorper eu odio.
Cardano (ADA) is flashing mixed signals as its market structure hints at an imminent short-term price crash. While bearish indicators suggest a possible decline, a crypto analyst reveals that the broader trend remains intact, with technical patterns supporting the potential for a rally toward the $0.9 mark.
Cardano Price Crash Incoming
TradingView Crypto analyst SiDec has released a bearish price forecast for Cardano, anticipating a significant correction toward the $0.75 area in the coming days. This cautious outlook is based on detailed analysis using Elliott Wave Theory, Fibonacci tools, and critical price action zones.
Related Reading
SiDec has stated that ADA’s price continues to consolidate after completing a 5-wave impulse move, signaling the end of its upward momentum. Following this strong impulse rally, the cryptocurrency is now exhibiting a classic Elliott Wave behavior, transitioning into a textbook ABC corrective pattern.
The cryptocurrency first experienced a pull-back, labeled as Wave A on the price chart, followed by a temporary recovery in Wave B. According to SiDec, Wave C is expected to complete the retracement pattern, with ADA’s final downward move nearing its end.
Currently, technical indicators and price action point to the $0.705 region as a high-probability long entry zone. The TradingView analyst also clarifies where ADA might find solid support during this corrective phase using Fibonacci Retracement zones.
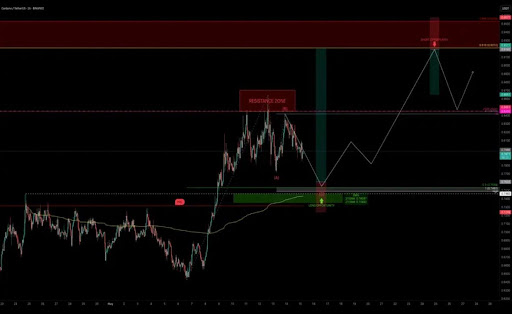
The 50% retracement level of the entire bullish 5-wave impulse is positioned approximately at $0.7534 — a critical price point that coincides closely with ADA’s previous price swing at $0.746. This former resistance level has yet to be revisited, making it a natural support candidate.
The analysis further identifies a 1:1 ABC extension for the anticipated correction in ADA, placing Wave C’s potential crash target around $0.7492. This also creates a tight cluster of technical indicators in the range of roughly $0.75, indicating a strong support zone.
Further supporting this level, the daily 21 Exponential Moving Average (EMA) stands at $0.7455, while the daily 21 Simple Moving Average (SMA) is slightly lower at $0.7347. SiDec has also identified the Point of Control (POC), which marks the price with the highest volume, near $0.7318.
The analyst further highlights that Cardano’s anchored Volume Weighted Average Price (VWAP) resides within the $0.75 support zone. At the same time, the Pitchfork tool’s golden pocket aligns dynamically as support around the same area.
ADA Price Path To $0.92 Holds Firm
While SiDec eyes a potential crash to new lows for ADA in the near term, the analyst’s chart also shows a green zone, with a projected bullish bounce drawn. Following its Wave C crash, Cardano is expected to rebound and approach the $0.92 level.
Related Reading
The TradingView analyst has advised caution around this area, as $0.92 acts as a significant resistance zone and coincides with a prior liquidity zone that could trigger rejection or profit-taking.
SiDec has emphasized that the risk-to-reward ratio around this area will only become favorable once there is clear confirmation, such as an SFP, a bearish engulfing candle, or visible divergence. Overall, if the $0.75 support zone holds, Cardano, which is currently trading at $0.78, could be positioned for a strong recovery toward $0.92 and beyond.
Featured image from Unsplash, chart from Tradingview.com