
Solana Jumps 9% — Will It Break $200 Soon?
Key Notes
- Solana trades at $165 after an 8% daily gain, supported by rising trading volume.
- Ethereum’s 21% increase post-Pectra has pushed the SOL/ETH ratio to a one-month low.
- Analyst highlights a cup and handle pattern on SOL’s weekly chart, with $200 as a breakout trigger.
Solana
SOL
$150.7
24h volatility:
2.6%
Market cap:
$78.04 B
Vol. 24h:
$3.80 B
has rallied over 8% in the past 24 hours to trade around $165. This strong upward move comes as the broader crypto market witnesses a 5.3% jump in total market capitalization, sparking renewed interest in altcoins.
SOL, which had been stuck below the $150 mark for over two months, has now seen its value go up by more than 50% over the past month. Its market capitalization has risen to $86 billion, up 62% in the same period.
Meanwhile, Solana’s competitor, Ethereum
ETH
$1 845
24h volatility:
2.6%
Market cap:
$222.72 B
Vol. 24h:
$14.22 B
, recently activated its long-awaited Pectra upgrade, leading to a notable uptick in activity and 21% price increase in the past day alone. This has dragged down the SOL/ETH ratio to its lowest point in nearly a month.
According to Coinglass, Ethereum registered $248 million in spot inflows over the last 24 hours, more than triple Solana’s $94 million. BitMEX co-founder Arthur Hayes commented, “It’s fundamental season,” referring to the renewed attention on layer-1 protocols.
It’s fundamental szn bitches. Fuck your no client, no revenue shitcoins. Give me that cash money in the form of buy back and burn. $ETHF = the Amex of #crypto pic.twitter.com/VvjPIFiDpv
— Arthur Hayes (@CryptoHayes) May 9, 2025
Sol price outlook
On the daily chart, SOL is currently testing the upper Bollinger Band at $169.90, indicating short-term overbought status. If SOL manages to break and sustain above this level, it could push towards the next resistance zones at $170 and $180.
However, rejection at this band could send the price to the middle band (20-day SMA) at $162.11, and possibly further down to the lower band at $135.62.
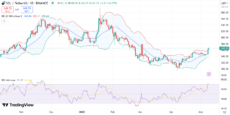
SOL price chart with RSI and Bollinger Bands | Source: Trading View
The RSI currently sits at 71.67, reinforcing bullish momentum. However, it also flags potential for a near-term correction if overbought conditions persist.
Meanwhile, the MACD on the daily chart shows a positive crossover, signaling bullish momentum. Sustained break above $170 with a strong MACD could lead the 6th largest cryptocurrency to $180.
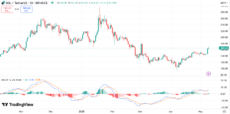
SOL price chart with MACD | Source: Trading View
Popular crypto analyst Ali Martinez recently noted on X that SOL has been forming a bullish cup and handle pattern on the weekly chart since late-2021. According to him, clearing the $200 mark could result in a major bull run for Solana.
#Solana $SOL clearing the $200 mark could spark a massive bull run! pic.twitter.com/VqThvz1xvX
— Ali (@ali_charts) May 8, 2025
Other analysts echoed, saying that SOL could “print some god candles” if the broader crypto market continues its upward trend.
Disclaimer: Coinspeaker is committed to providing unbiased and transparent reporting. This article aims to deliver accurate and timely information but should not be taken as financial or investment advice. Since market conditions can change rapidly, we encourage you to verify information on your own and consult with a professional before making any decisions based on this content.

A crypto journalist with over 5 years of experience in the industry, Parth has worked with major media outlets in the crypto and finance world, gathering experience and expertise in the space after surviving bear and bull markets over the years. Parth is also an author of 4 self-published books.