

VanEck Submits S-1 Document for Its BNB ETF: New ATH Soon?
Key Notes
- VanEck has submitted the Form S-1 registration for a first-of-its-kind U.S.-based BNB ETF.
- If approved, the ETF would allow staking of held BNB to earn additional yield.
- BNB has been consolidating in a symmetrical triangle pattern since February, with analysts anticipating a breakout soon.
U.S. asset management giant VanEck has recently submitted the Form S-1 registration statement for its Binance Coin (BNB) exchange-traded fund (ETF).
The document includes detailed information about the “VanEck BNB ETF,” such as its business operations, financial condition, and the methodology for determining the offering price.
VanEck filed the ETF with the United States Securities and Exchange Commission (SEC) on March 31. It seeks to bring exposure to BNB within a regulated framework, much like its previous success with Bitcoin and Ethereum ETFs.
Unlike the 21Shares BNB ETP available in Europe, VanEck’s BNB ETF would target a U.S.-based clientele. If approved by the SEC, the BNB held in the trust could be staked to earn additional BNB or other income.
Though approval is not guaranteed, the narrative around BNB is already shifting. From a once heavily exchange-tied asset, traders now view it as a key component of the Web3 infrastructure.
BNB Price Outlook
The filing has stirred speculation around the token’s price growth and potential adoption in traditional financial systems. At the time of writing, BNB is trading around $593, with no loss or gain in the past day.
It is interesting to note that BNB has been trading within a symmetrical triangle pattern on the daily chart since February. With the price nearing the triangle’s apex, analysts believe that a breakout appears imminent.
If bulls push the price above the resistance at $615, the next major target lies around $640–$650. However, a breakdown below the $580 support could lead BNB to the lower trendline near $560.
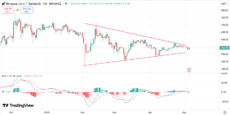
BNB price chart | Source: Trading View
Meanwhile, on the daily BNB price chart, the signal line is slightly above the MACD line, suggesting minor bearish pressure. The histogram shows minimal divergence, pointing to a potential momentum shift.
The RSI sits around 52, indicating neutral momentum. This leaves room for price action to swing in either direction based on market catalysts.
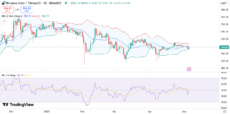
BNB price chart with Bollinger Bands | Source: Trading View
On the other hand, Bollinger Bands are narrowing with the price currently hugging the middle band (20-day SMA). This hints at an upcoming major move. A sustainable break above the upper band near $614 could result in bullish momentum.
Disclaimer: Coinspeaker is committed to providing unbiased and transparent reporting. This article aims to deliver accurate and timely information but should not be taken as financial or investment advice. Since market conditions can change rapidly, we encourage you to verify information on your own and consult with a professional before making any decisions based on this content.

A crypto journalist with over 5 years of experience in the industry, Parth has worked with major media outlets in the crypto and finance world, gathering experience and expertise in the space after surviving bear and bull markets over the years. Parth is also an author of 4 self-published books.