
Whales Continue to Accumulate Ethereum, ETH Rally Ahead?
Key Notes
- ETH surged to $1,787, gaining 13% in just 24 hours.
- A whale who lost $40 million on April 9 returned to accumulate nearly 20,000 ETH.
- Spot Ether ETFs saw a $38.74 million inflow, ending a 10-day drought.
Early on April 23, Ethereum
ETH
$1 798
24h volatility:
10.3%
Market cap:
$217.16 B
Vol. 24h:
$27.77 B
recorded a 13% daily surge in its value, trading around $1,787 at the time of writing. The rally has pushed its 24-hour trading volume up by 73%.
This surge comes as whale activity increased for the second-largest cryptocurrency. A large investor who had previously incurred a $40 million loss during the April 9 crash, when ETH briefly touched $1,400, returned back for accumulation.
After the $ETH price rose, this whale, who lost ~$40M on $ETH, borrowed 34.75M $USDT from #Aave to buy 19,973 $ETH at $1,740.https://t.co/yycsVmOLrP pic.twitter.com/lQVFXmV0fx
— Lookonchain (@lookonchain) April 23, 2025
As per the data shared by Lookonchain, this whale borrowed 34.75 million USDT on Aave and purchased 19,973 ETH at $1,740 — a bold comeback bet on the rally.
Another whale, wallet 0x2088, scooped up 2,568 Ether for around $4.61 million at $1,794. Meanwhile, address 0xD20E pulled 5,531 ETH — worth nearly $9.8 million — from Binance, a move typically indicating intent for long-term holding.
ETH just hit $1,800!
Whales continue to buy $ETH.
0xD20E withdrew 5,531 $ETH($9.8M) from #Binance in the past hour.
0x2088 spent 4.61M $USDC to buy 2,568 $ETH at $1,794 in the past 40 minutes.https://t.co/jzoEhDh2Fshttps://t.co/Gz3tdRjNWp pic.twitter.com/FoW5pZZOlM
— Lookonchain (@lookonchain) April 23, 2025
Additionally, on April 22, spot Ether exchange-traded funds (ETFs) broke a 10-day streak of flat or negative flows, recording a combined net inflow of $38.74 million.
It is important to note that Ether has been trading within a downward channel since mid-December 2024. The recent breakout from this range has led many analysts to predict a bull rally ahead. Popular crypto trader Christiaan on X has set a price target of $2,690 for ETH in the near term.
$ETH Send it ✅ pic.twitter.com/HUOkSrRTQZ
— Christiaan (@ChristiaanDefi) April 22, 2025
Analyst “Ash Crypto” echoed this bullish sentiment, comparing ETH’s chart pattern to Bitcoin’s explosive trajectory from late 2024.
$ETH IS ABOUT TO EXPLODE 🚀 pic.twitter.com/mMiFXpLzzJ
— Ash Crypto (@Ashcryptoreal) April 22, 2025
On April 22, Rekt Capital noted that while ETH’s dominance recently dropped to the critical 2019 support level of 7%, it has since bounced back. If the cryptocurrency manages to sustainably rise its dominance, it could reclaim its position in the broader market.
$ETH Dominance
Since dropped to new All Time Lows, Ethereum Dominance has managed to protect 2019 All Time Lows as support (black) for now
ETH Dominance needs to Monthly Close inside green so as to develop a reversal base like back in 2019-2020#ETH #Crypto #Ethereum https://t.co/Ubh8iDpx6j pic.twitter.com/3DXw4udWa2
— Rekt Capital (@rektcapital) April 22, 2025
Ethereum (ETH) Price Outlook
On the daily ETH price chart, the RSI currently stands around 54.75 with an upward gradient. This suggests the bullish momentum could continue if the buying volume remains high.
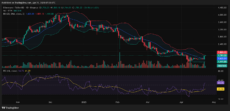
ETH price chart | Source: TradingView
Meanwhile, the price is currently hugging the upper Bollinger Band around $1,800. If ETH breaks above the upper band, it could trigger further buying — although such a move may also signal short-term overbought conditions.
If Ether maintains its course above the middle Bollinger Band and keeps RSI above the neutral 50 mark, a more sustained breakout is likely.
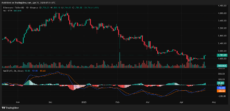
ETH price chart | Source: Trading View
The MACD shows a bullish crossover, supported by rising green histograms, underscoring the underlying positive sentiment.
Disclaimer: Coinspeaker is committed to providing unbiased and transparent reporting. This article aims to deliver accurate and timely information but should not be taken as financial or investment advice. Since market conditions can change rapidly, we encourage you to verify information on your own and consult with a professional before making any decisions based on this content.

A crypto journalist with over 5 years of experience in the industry, Parth has worked with major media outlets in the crypto and finance world, gathering experience and expertise in the space after surviving bear and bull markets over the years. Parth is also an author of 4 self-published books.