

Whales Double Down on Bitcoin Despite ETF Exit — Time to Buy?
Key Notes
- US spot Bitcoin ETFs saw a $56.23 million net outflow on April 30.
- BTC quickly rebounded and is now hovering near the $95,000 mark.
- Whale wallets accumulated over 43,100 BTC in two weeks, signaling bullish sentiment.
Bitcoin
BTC
$95 121
24h volatility:
0.5%
Market cap:
$1.89 T
Vol. 24h:
$27.07 B
price briefly dropped on April 30, following an outflow in the US-listed spot Bitcoin ETFs — the first in two weeks. The net outflow of $56.23 million came as Fidelity’s FBTC and Ark & 21Shares’ ARKB neutralized BlackRock IBIT’s $267 million inflow.
This negative flow created a temporary selling pressure, sending BTC around the $93,000 mark. However, at the time of writing, the largest cryptocurrency has recovered its way back around $95,000.
Despite the outflow, the Bitcoin Accumulation Trend Score is approaching 1, a sign that network-wide buying is concentrated among larger holders. Whales have accumulated over 43,100 BTC from April 13 to 27, according to Ali Martinez.
The #Bitcoin $BTC Accumulation Trend Score is nearing 1, signaling that larger entities, or a significant portion of the network, are actively accumulating. pic.twitter.com/eJavuF8Dmb
— Ali (@ali_charts) April 30, 2025
Meanwhile, data from LookOnChain reveals that BlackRock’s IBIT scooped up over 25,430 BTC, worth nearly $2.4 billion, over the past week alone. The accumulation has brought its total BTC holdings to 601,209 BTC.
BlackRock (IBIT) accumulated 25,430 $BTC($2.37B) over the past 7 days, bringing its total holdings to 601,209 $BTC($56.11B).https://t.co/kqNUqHBiTn pic.twitter.com/qxsY4sY2Ay
— Lookonchain (@lookonchain) April 30, 2025
On the other hand, the Net Unrealized Profit/Loss (NUPL) currently places long-term holders in a psychological “denial” phase, typically marked by uncertainty about whether a local top is forming.
According to the NUPL metric, long-term #Bitcoin $BTC holders are currently in the “denial” phase! pic.twitter.com/4fRGRpJ2ad
— Ali (@ali_charts) April 30, 2025
Still, analysts remain optimistic. Martinez noted that the Bitcoin MVRV ratio is testing the 1-year Simple Moving Average (SMA).
#Bitcoin $BTC momentum could shift bullish once the MVRV crosses above its 1-year SMA. A golden cross that historically signals strong upside potential. pic.twitter.com/FDyWJYYfsk
— Ali (@ali_charts) April 30, 2025
If the MVRV decisively crosses above this level, it could catalyze a move toward the $114,230, the next key target based on MVRV pricing bands.
Btc price outlook
On the daily BTC price chart, the RSI is trending near 66, hinting at continued strength but also cautioning against potential exhaustion. Failure to hold $93,198 may expose BTC to deeper retracement toward $83,444, a historically strong support zone.
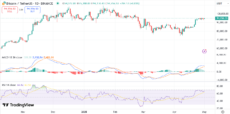
BTC price chart | Source: TradingView
The MACD is currently in bullish territory, with the MACD line crossing above the signal line. However, the histogram is beginning to flatten, signaling possible weakening momentum if price continues to consolidate without volume.
#Bitcoin $BTC is testing its Realized Warm Supply at $94,550, holding above it could signal mid-term holder support. pic.twitter.com/Q4zLRbQDXb
— Ali (@ali_charts) May 1, 2025
BTC is also holding above its Realized Warm Supply level of $94,550, suggesting support from mid-term holders. A sustained close above $95,870 could ignite a push toward $100,000 and beyond.
Disclaimer: Coinspeaker is committed to providing unbiased and transparent reporting. This article aims to deliver accurate and timely information but should not be taken as financial or investment advice. Since market conditions can change rapidly, we encourage you to verify information on your own and consult with a professional before making any decisions based on this content.

A crypto journalist with over 5 years of experience in the industry, Parth has worked with major media outlets in the crypto and finance world, gathering experience and expertise in the space after surviving bear and bull markets over the years. Parth is also an author of 4 self-published books.