

Why is Bitcoin price up today, November 5?
Bitcoin price climbed above $80,000 on November 5, recovering from a seven-week low as fresh spot ETF inflows, rising U.S. stocks and heavy short liquidations supported the cryptocurrency’s rebound.
Summary
- Bitcoin price has recovered above $80,000 after falling near $75,600 during the November 3 U.S. midterm elections.
- U.S. spot Bitcoin ETFs recorded $74.6 million in net inflows on November 4, reversing three consecutive sessions of withdrawals.
- Fidelity’s FBTC attracted $236.7 million, while BlackRock’s IBIT lost $201.2 million, showing that institutional flows remain mixed.
- A short squeeze accelerated the recovery, with almost $378 million in bearish crypto positions liquidated within one hour.
- Bitcoin faces resistance around 81,300–82,000, while CryptoQuant analyst CryptoZeno warns that the market correction may not be over.
The recovery followed $74.6 million in net inflows into U.S. spot Bitcoin ETFs on November 4, according to Farside Investors. Fidelity led the buying, while traders betting against Bitcoin faced substantial losses as prices moved higher.
According to crypto.news market data, BTC traded around $80,320 at press time, gaining more than 3% over 24 hours, after briefly falling toward $75,600 during the U.S. midterm election results. The cryptocurrency subsequently recovered above $81,000 before settling near the $80,000 level.
Meanwhile, the recovery extended across the cryptocurrency market, with Ethereum (ETH) rising almost 6% to approximately $2,425, while XRP gained 3% to $1.31. Solana (SOL) climbed 4% to $96, and BNB advanced 2% to around $710.
Notably, Zcash (ZEC) led gains among major cryptocurrencies, jumping over 7% to nearly $1,320, with $1.2 billion in trading volume over the previous 24 hours.
Bitcoin price rises as ETF inflows return after three-day selloff
Institutional investment flows turned positive on Wednesday after three consecutive trading sessions of withdrawals from U.S. spot Bitcoin funds.
Fidelity’s FBTC attracted $236.7 million, its largest daily inflow in the latest reported sessions. Bitwise’s BITB added $15.2 million, while ARK Invest’s ARKB received $19.9 million.
BlackRock’s IBIT, however, recorded $201.2 million in withdrawals, partially offsetting the money entering other funds.
The combined inflows came after investors withdrew $643.2 million on October 30, followed by $398.6 million on November 2 and $115.6 million on November 3.
Those three sessions removed approximately $1.16 billion from Bitcoin ETFs before the latest reversal.
As crypto.news previously reported, Bitcoin initially struggled to recover despite signs that selling pressure was easing during the election count.
The November 4 ETF figures now provide evidence of renewed net investment, although inflows have not yet recovered the money withdrawn during the preceding sessions.
U.S. midterm results and short liquidations lift Bitcoin
Bitcoin’s recovery gathered momentum as financial markets stabilized after Democrats won control of both chambers of Congress.
The election initially unsettled cryptocurrency traders because Democratic lawmakers could take a tougher approach to pending digital asset legislation.
However, U.S. stocks subsequently recovered, with the S&P 500 rising approximately 1.6% as investors assessed the election results.
Oil prices fell considerably during the same period, while a weaker dollar and lower Treasury yields supported demand for risk assets.
The Bitcoin price recovery coincided with approximately $378 million in cryptocurrency short liquidations within one hour.
At press time, CoinGlass data showed that total liquidations reached almost $747 million during that period. Short liquidations occur when exchanges forcibly close leveraged bets against an asset, creating additional buying pressure when traders must cover their positions.
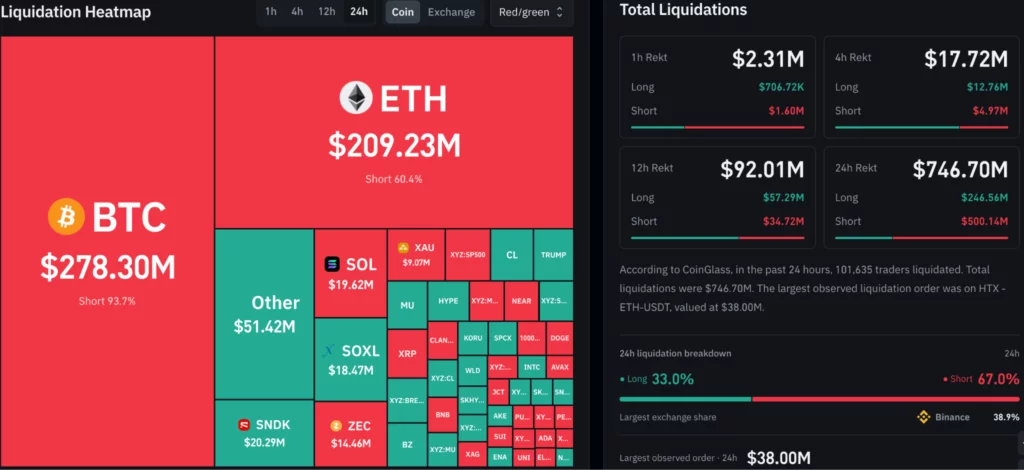
Bitcoin’s rebound from roughly $75,600 to above $80,000 therefore occurred alongside both improving market sentiment and forced buying by leveraged traders.
Bitcoin price prediction: can BTC reach $82,000?
On the daily chart, Bitcoin is showing signs of improving momentum after recovering from its recent decline.
At approximately $80,688, BTC traded above the middle Bollinger Band at $80,273.86, placing the price back above a commonly watched short-term trend indicator.
The Relative Strength Index recovered to 51.28, compared with its moving average of 41.87, suggesting that buying momentum had improved.
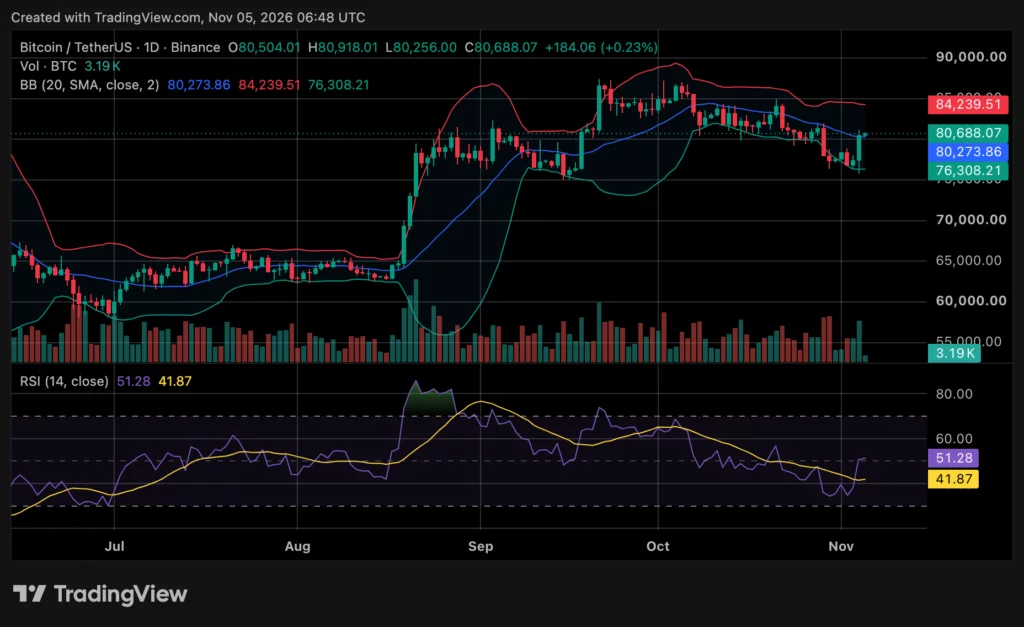
However, the RSI remained near the middle of its range, leaving room for further price movement in either direction.
Bitcoin’s immediate resistance lies around $81,300 to $82,000. A sustained recovery above that area could bring the upper Bollinger Band near $84,240 into focus.
On the downside, the middle band around $80,274 provides initial support, followed by the lower Bollinger Band near $76,308.
Crypto analyst Ted argued that Bitcoin’s ability to absorb negative developments suggested that “the bottom is in.”
He nevertheless estimated only a 16% probability of Bitcoin reaching a new all-time high by July 2027, while suggesting a potential record could come later that year.
His forecast remains an opinion, with no independently established probability model accompanying the cited statement.
CryptoQuant warns Bitcoin correction may continue
A more cautious assessment came from CryptoQuant contributor CryptoZeno, who argued that Bitcoin’s market cycle has not yet reached conditions typically associated with a confirmed bottom.
He reported that the Bitcoin Cycle Extremes Index had fallen to 15.8% on its 30-day moving average.
The reading placed the market in what he described as the “Watch / Mild Pressure” zone, suggesting that speculative activity had cooled without confirming the end of the correction.
His Cycle Extreme Oscillator remained below the 1.0 threshold associated with stronger market activity during previous cycles.
CryptoZeno said the indicators supported the possibility of further consolidation or another decline before a lasting recovery develops.
He identified a sustained recovery in both indicators as necessary evidence of improving market conditions.
Disclosure: This article does not represent investment advice. The content and materials featured on this page are for educational purposes only.