
Bitcoin Price Caught Between Bullish Averages and $84K Resistance
Key Takeaways
- Bitcoin’s price trades around $83,250 and $83,790, as buyers defend $83,000 support while sellers hold resistance around $84,250.
- Bitcoin’s moving averages favor bulls, with 12 bullish readings, but momentum indicators remain mixed.
- Bitcoin faces a potential move toward $85,000 above $84,250, while losing $83,000 exposes $82,500.
Bitcoin Price Holds Above $83,000 as Bullish Signals Clash With Stubborn Resistance
Bitcoin’s price was hovering around $83,250 and $83,790 on Wednesday, Oct. 14, 2026, with an intriguing contradiction brewing beneath the surface: 12 of 15 moving average indicators favored the bulls, yet the cryptocurrency remained unable to convincingly reclaim $84,000.
While the broader technical picture suggests bitcoin’s recovery from its recent lows still has legs, the hourly and four-hour charts tell a more cautious story, with sellers repeatedly defending overhead resistance and buyers struggling to convert their improving technical position into a decisive breakout.
Bitcoin’s Hourly Chart Reveals a Market Running in Place
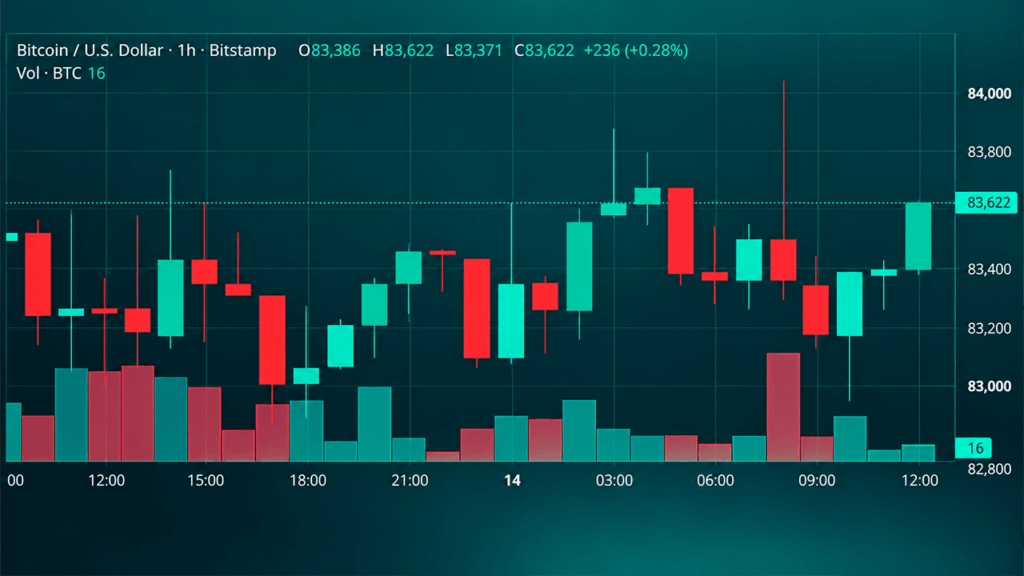
The one-hour chart shows bitcoin trading in a relatively narrow corridor between $83,000 and $83,800, with neither camp demonstrating sufficient conviction to seize control. After recovering from lower prices, BTC settled around $83,350 to $83,370, accompanied by moderate trading activity and diminishing short-term momentum.
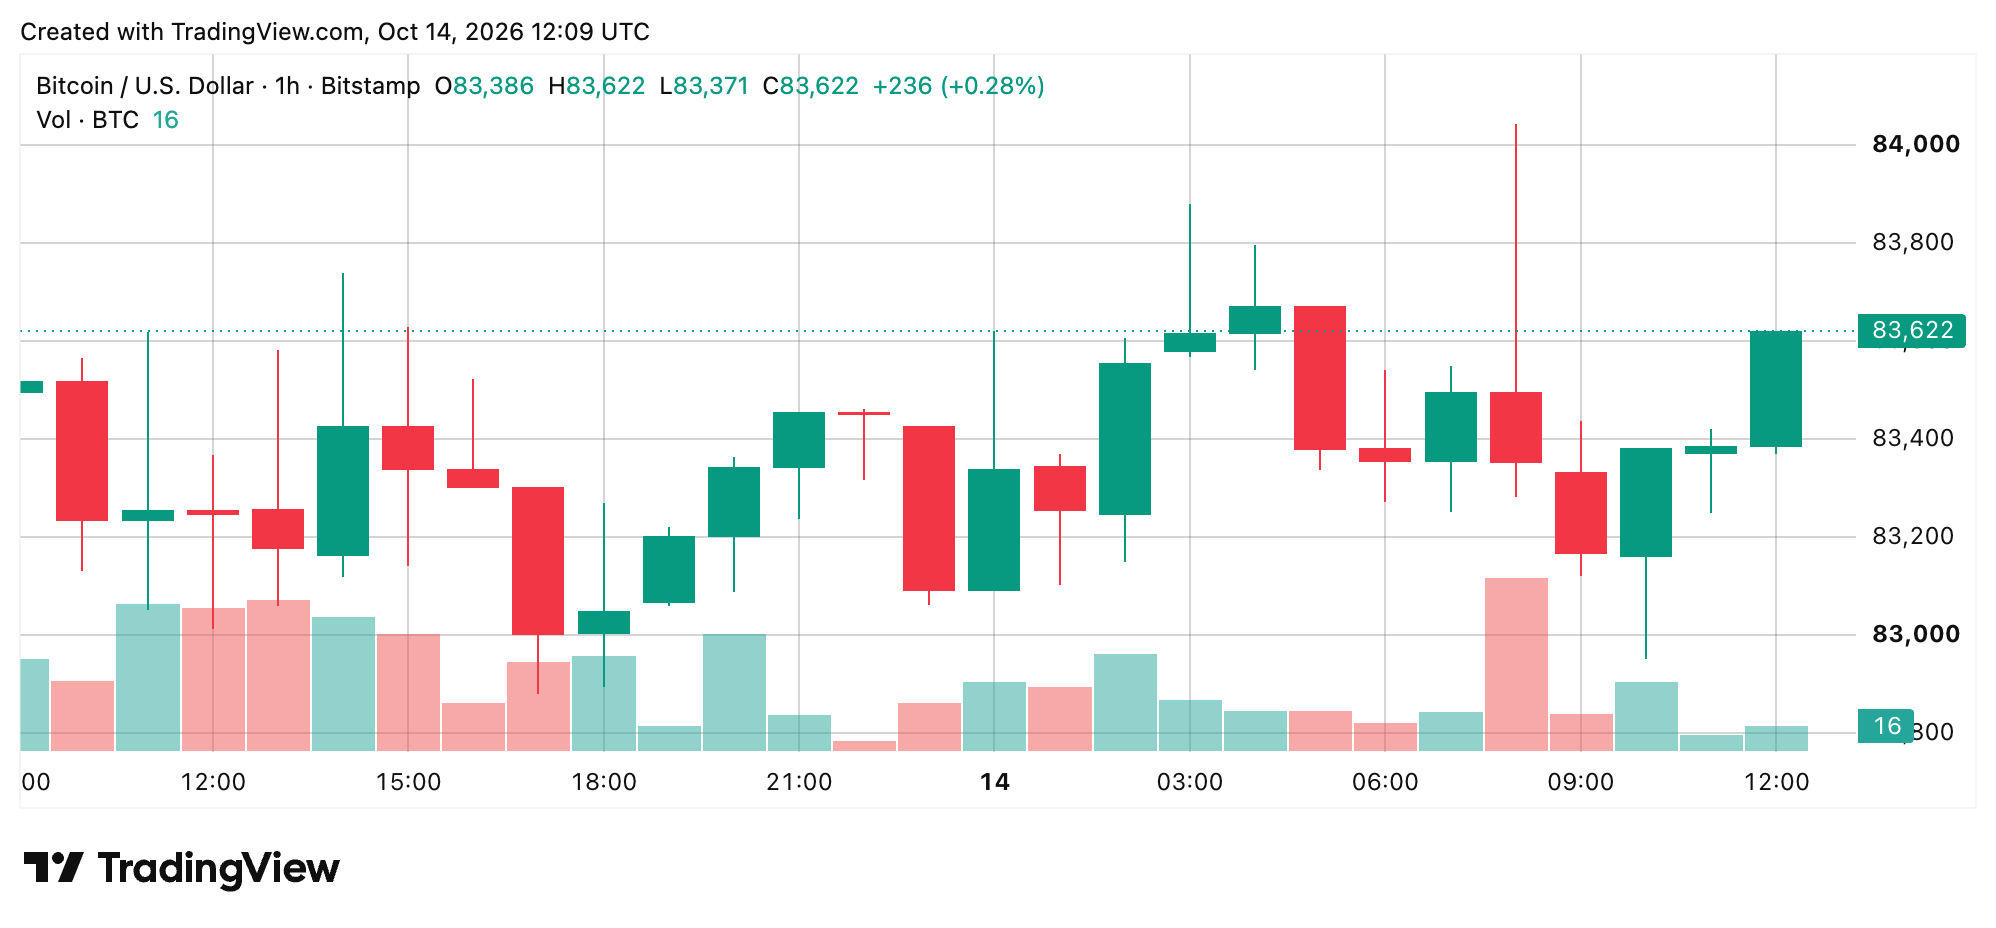
Support between $83,000 and $83,200 remains the first defensive position for buyers, while resistance at $83,500 to $84,000 continues to complicate upward attempts. A convincing move beyond $83,800 would put $84,000 to $84,250 back in play, whereas losing $83,000 would expose the market to another examination of $82,500. For now, the hourly chart resembles a market waiting for a catalyst rather than one prepared to declare a winner.
Four-Hour Recovery Faces Its Toughest Test Near $84,250
The four-hour chart presents a somewhat more encouraging picture, although the bulls still have unfinished business. Bitcoin’s recovery from approximately $80,308 demonstrated meaningful demand at lower prices, but the subsequent advance stalled around $84,254, establishing a formidable overhead obstacle.
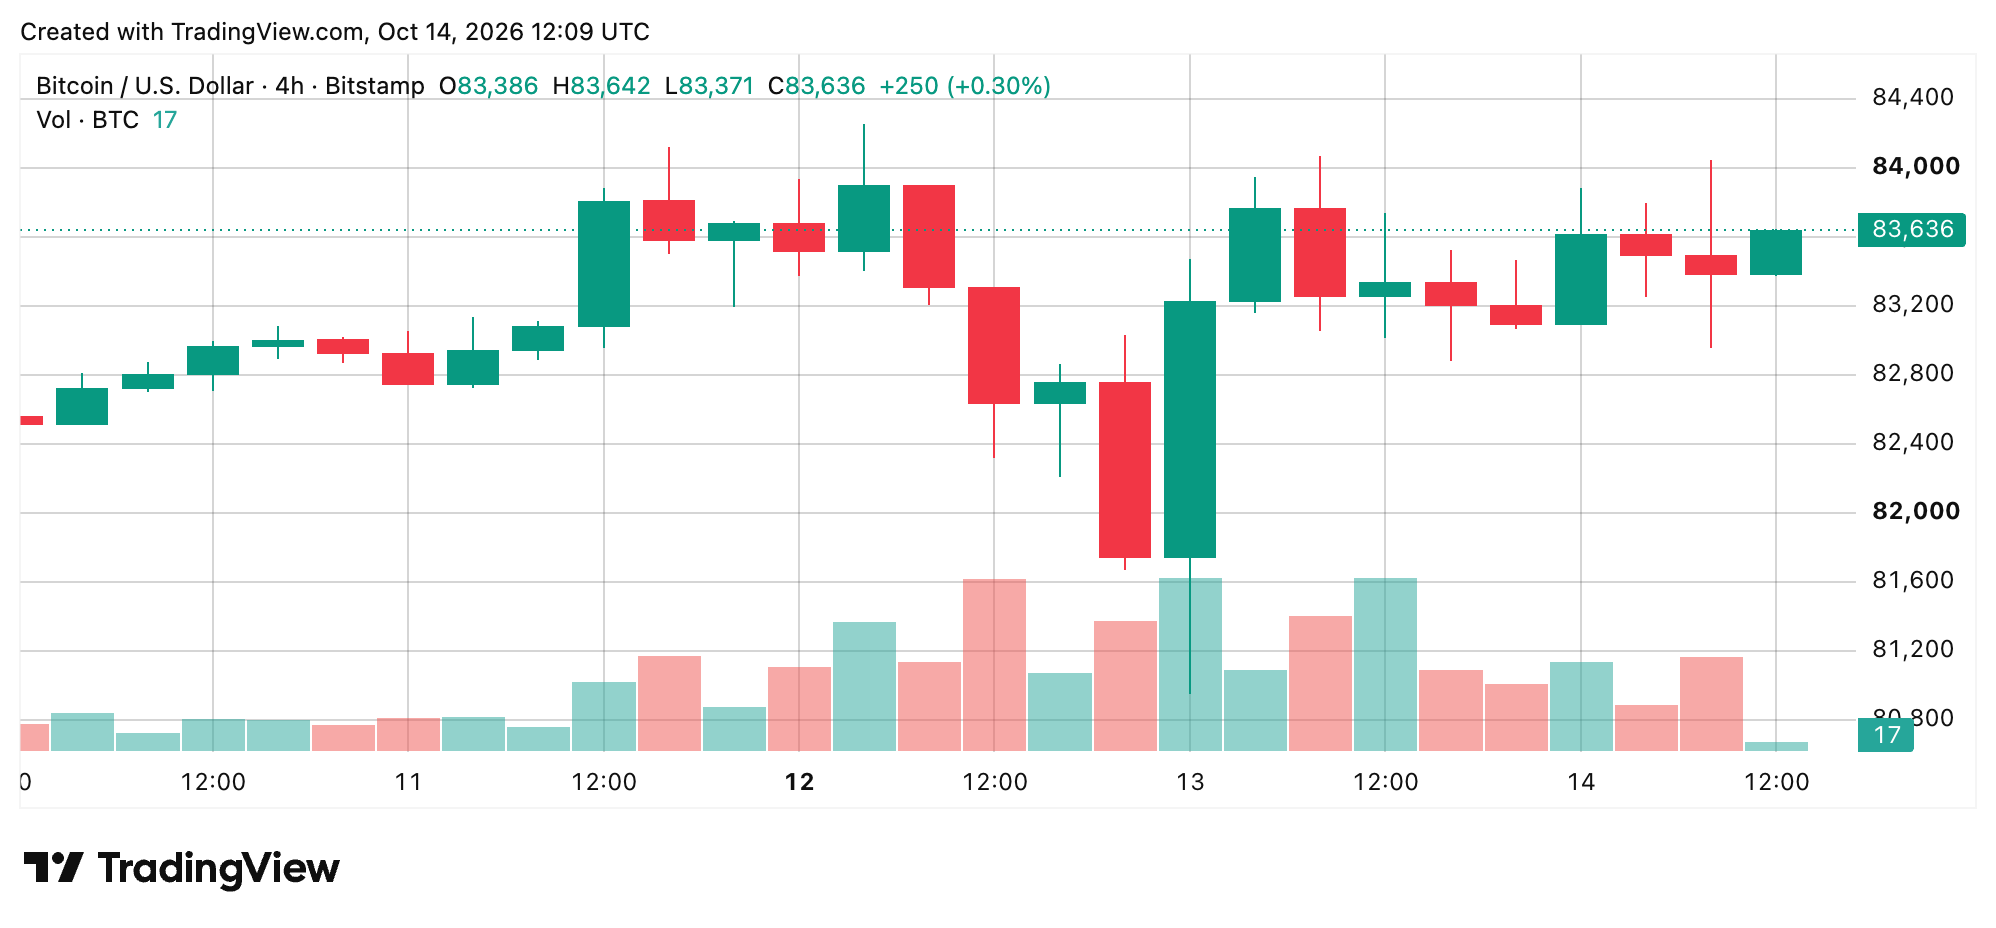
Repeated encounters with the $83,800 to $84,000 region have produced little lasting progress, suggesting sellers remain comfortable defending that territory. A decisive four-hour close above $84,250, ideally accompanied by expanding volume, would strengthen the argument for an advance toward $85,000. Conversely, another rejection would leave the door open to $82,000 to $82,500, potentially forcing buyers to defend the very foundation of their recent recovery.
Daily Chart Keeps Bitcoin’s Broader Recovery Alive
On the daily chart, bitcoin’s rebound from approximately $74,913 remains an important feature of the prevailing market structure, even after the rejection near $87,374 interrupted its upward trajectory. The cryptocurrency is now consolidating around $83,300 to $83,400, with immediate support extending from roughly $82,000 to $82,900 and resistance concentrated between $84,000 and $85,000.
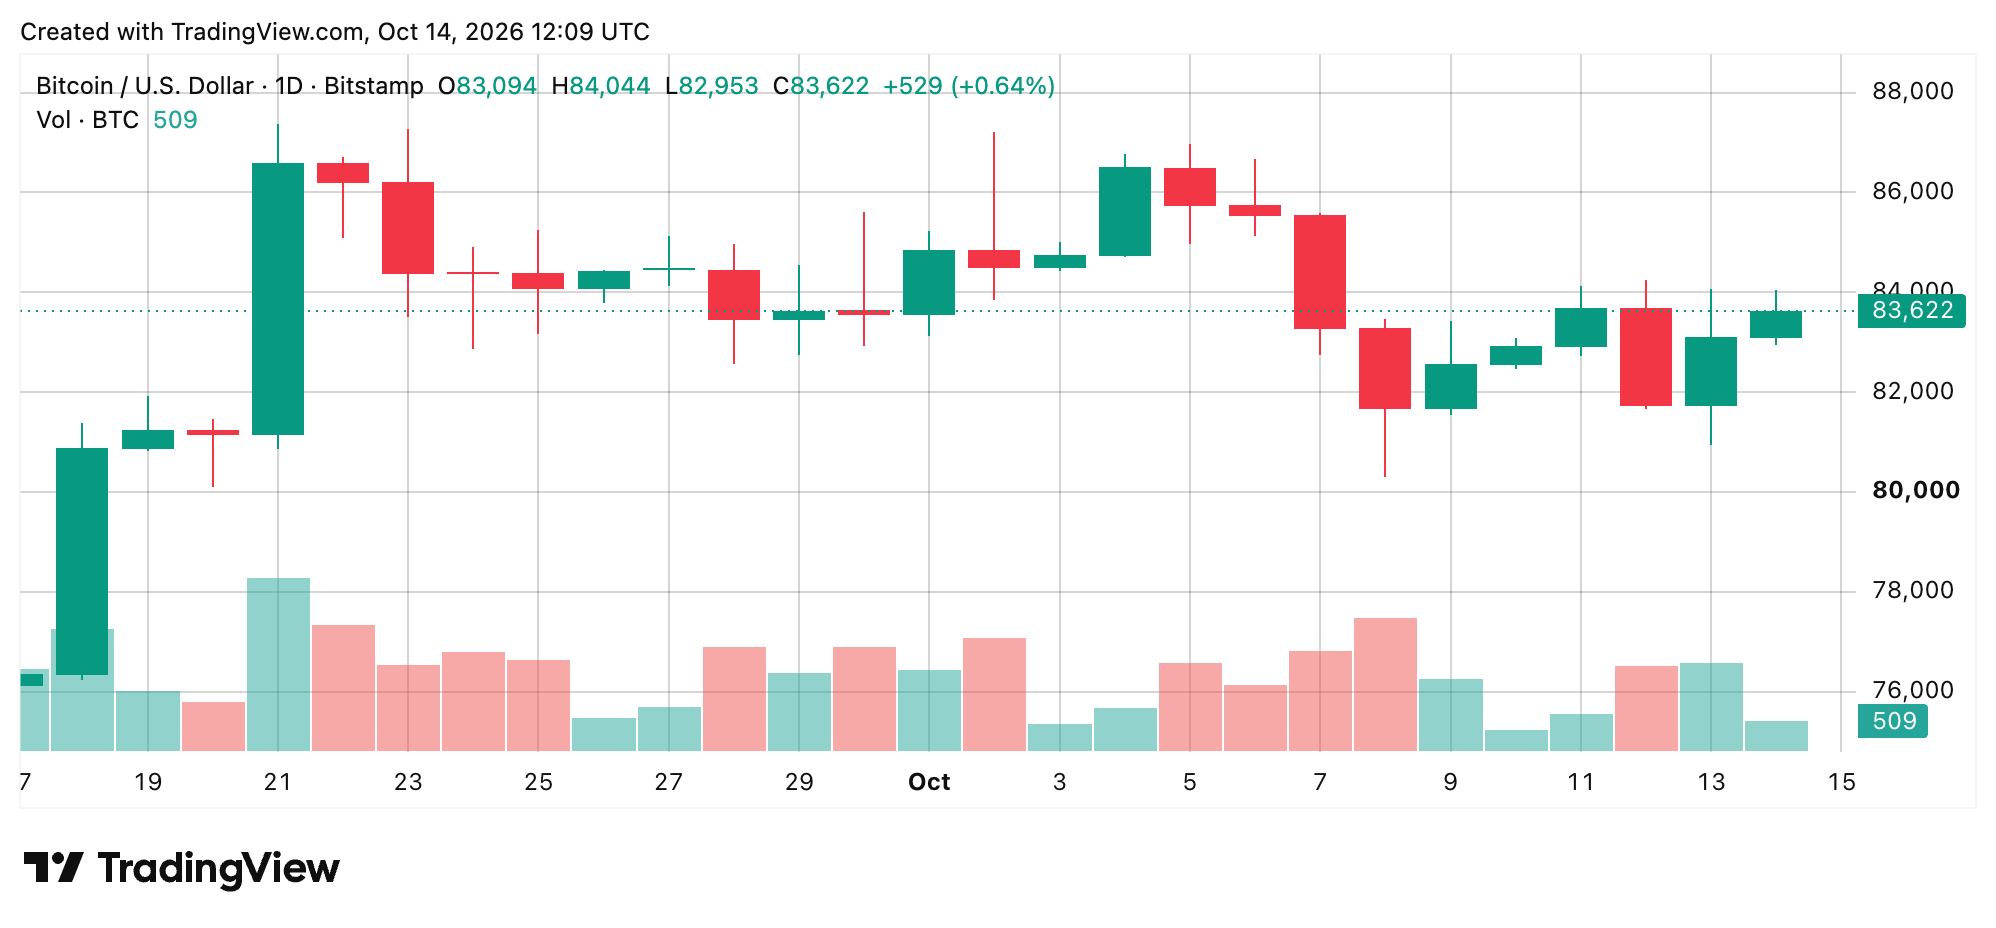
The broader ascending channel framework remains relevant, but its durability depends increasingly on buyers protecting the lower boundaries of recent trading ranges. A daily close beneath $81,000 would materially weaken the recovery argument, while renewed strength above $85,000 would improve the prospects of revisiting higher resistance. The market is still recovering, but its margin for error has narrowed.
Oscillators Deliver a Mixed Verdict as Momentum Falters
Bitcoin’s oscillators on the daily chart offer little evidence of an imminent directional resolution. The relative strength index (RSI) stands at 53, while the Stochastic registers 35, both occupying neutral territory. The commodity channel index (CCI) at minus 34 and the average directional index (ADX) at 27 reinforce that indecision. Meanwhile, the Awesome oscillator (AO) reads 706, although momentum is at minus 3,123, and the moving average convergence divergence (MACD) at 587 carries bearish classifications.
The Stochastic RSI fast reading of 17, Williams percent range at minus 55, and Ultimate oscillator (UO) at 47 remain neutral, while the bull bear power at 483 provides the lone bullish classification. Altogether, eight neutral, two bearish, and one bullish signal describe a market with conflicting impulses rather than a unified trend.
Moving Averages Favor the Bulls, but Resistance Holds Firm
The moving average (MA) picture is considerably more optimistic, with 12 bullish signals against two bearish readings and one neutral classification. Bitcoin trades above its 10-period exponential moving average (EMA) at $83,276, its 30-period exponential moving average (EMA) at $82,385, and its 50-period simple moving average (SMA) at $81,202.
Longer-term support is similarly encouraging, with the 200-period exponential moving average (EMA) at $75,647 and 200-period simple moving average (SMA) at $72,215. Nevertheless, the 20-period simple moving average (SMA) at $83,896 and volume-weighted moving average (VWMA) at $83,733 remain overhead.
| 🟢 Bull Verdict | 🔴 Bear Verdict |
|---|---|
| A sustained breakout above $84,250 would open the door to $85,000, with $86,000 emerging as the next upside target. | A break below $83,000 would put $82,500 in play, while $81,000 stands as the more critical line of defense. |